Introduction
The Role of Research in Education
Educational progress doesn’t happen by accident. It depends on well-conducted research. Without solid research, programs drift. They lack direction and don’t improve. To build stronger systems, we need facts. Those facts must be reliable, valid, and gathered with care.
Usually, researchers gather this information using specific tools. Each tool works through a planned process. It’s not enough to guess or go by feel. Whether using a form, a test, or a rating scale—every device plays a part. However, no tool is perfect. Each has strengths, and each has limits.
To get better results, one tool isn’t enough. Researchers need to use tools in combination. When they do, the tools strengthen each other’s work. That’s how better data emerges.
John Best put it well in 1992. He said tools are like those in a carpenter’s box. Each fits a different situation. Whether building furniture or gathering data, purpose matters. So does timing. He warned that tools come with hazards too. Some fit better than others, depending on context.

For good results, researchers must think carefully. They should choose tools based on their exact needs. A tool’s value isn’t just in its function—it’s in when and how it’s used.
🛠️ Types of Research Tools
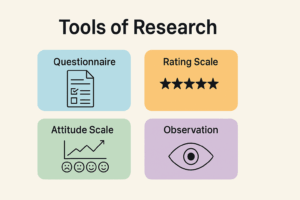
There are many tools researchers rely on to gather information. Some are structured and formal. Others focus on feelings or behavior. The most used include:
- Inquiry forms
- Questionnaires
- Interview schedules
- Rating scales
- Scorecards
- Attitude scales
- Interviews
- Observation schedules
- Sociometry tests
Each one brings something unique to the table. Some measure emotions. Others track behaviors or opinions. Some work best with numbers, while others help interpret deeper meanings.
Understanding Questionnaires in Research
In research work, one of the most commonly used tools is the questionnaire. It’s simple in appearance, but surprisingly powerful when crafted with care. A questionnaire allows a researcher to ask questions and gather answers in a structured way. Usually, the respondent fills it out alone, without any help from the investigator.
The strength of the questionnaire lies in its design. It’s not just a random list of questions. Rather, it follows a system. Each question is placed with a purpose. Researchers use it to explore opinions, behaviors, or facts from a specific group of people. So, the form becomes a bridge between curiosity and clarity.
There are two main types of items found in a questionnaire. The first is closed or structured. These offer choices. Respondents must pick from options—like yes or no, or select from a scale. The second type is open-ended or unrestricted. Here, the person gives answers in their own words. This lets researchers get deeper insights, though it takes longer to analyze.
When building a questionnaire, planning matters. Every item should relate to the goal. Questions that deal with similar topics are grouped. These groups can form categories. Categories help the respondent stay focused and make the analysis easier later.
Now, the arrangement of questions doesn’t follow one fixed rule. There are many ways to order items. Some researchers prefer chronological flow, while others sort by theme. The key is to stay flexible. The structure should match the study, not the researcher’s habit.
In short, questionnaires help researchers reach many people quickly. They collect data on knowledge, preferences, and feelings. If done well, the results offer valuable insights. But poor design can lead to confusion or misinterpretation. That’s why care and thought must go into every word on the page.
Measuring with Rating Scales
Another essential tool in research is the rating scale. Unlike questionnaires that ask direct questions, rating scales measure opinion and judgment. They show how much or how little someone agrees with something. They also help capture the intensity of a feeling, not just the presence of it.
Simply put, a rating scale assigns numbers to thoughts. These numbers turn opinions into data. That’s what makes them so helpful. For example, a teacher might be evaluated with ratings across several traits—communication, preparation, and fairness. The scale translates human impressions into scores that researchers can study.
J.C. Aggarwal defined rating as expressing opinions about a situation, object, or person. These opinions sit on a scale—from low to high. Once placed on the scale, the judgments become measurable. This process makes analysis possible.
Rating scales are used widely in education. They help in selecting teachers and predicting performance. They also show how students and staff perceive school activities. Beyond people, they also assess programs, courses, and teaching materials. Moreover, rating scales test the strength of many objective tools like inventories or checklists.
Researchers don’t have to stick to one type of scale. In fact, there are six main forms they can use:
Numerical scales: These use numbers to show degree.
Graphic scales: These rely on visual symbols or bars.
Descriptive scales: These provide text labels, like “very poor” to “excellent.”
Cumulative point scales: These add scores based on several items.
Standard scales: These follow a fixed format used across studies.
Pooled judgment scales: These combine multiple expert opinions.
Each kind has its use. The choice depends on what the researcher wants to measure and how detailed the analysis needs to be. For personality studies, descriptive scales might offer clarity. But if measuring course effectiveness, numerical or graphic scales may work better.
Bringing It All Together
While both questionnaires and rating scales serve different roles, they complement each other well. One gathers direct answers. The other measures subtle feelings. In combination, they paint a fuller picture of a subject.
A good research project often uses more than one tool. Mixing methods increases reliability. It also helps reduce errors. If one tool misses something, the other might catch it.
Finally, tools should always be matched to the situation. No method fits all problems. Researchers must look at their study goals and choose wisely. When that happens, data becomes more than numbers—it starts telling a story worth hearing.
Exploring Attitude Scales
Attitude scales, sometimes called opinion scales, are important tools in educational and social research. They help measure how individuals or groups feel about certain ideas, situations, or people. These tools don’t just collect facts—they dig into beliefs. They give researchers insight into emotions and thought patterns that aren’t easily observed.
Usually, an attitude scale consists of carefully written statements. Each statement reflects either a favorable or unfavorable view of a topic. Respondents then react to these statements, showing their level of agreement or disagreement. Through this process, researchers get a better picture of what people truly think.
In simple words, attitude means how a person feels deep inside about something. That feeling may be positive, negative, or somewhere in between. On the other hand, opinion is what the person actually says about that feeling. The attitude scale helps close the gap between silent thoughts and spoken words.
Two Techniques for Measuring Attitudes
To measure attitude in a reliable way, researchers often use two main methods. These are:
Thurstone’s technique of scaled values
Likert’s method of summated ratings
Let’s start with the Thurstone method. This approach involves creating a large group of statements—usually twenty or more. These statements show different opinions about the topic being studied. Some are positive, some negative, and some in between.
A panel of judges, usually fifty or more people, then steps in. They sort the statements into groups based on how strongly each expresses a certain view. There are typically eleven categories, going from very unfavorable to very favorable. If the judges strongly disagree about a statement’s placement, that item is removed. This helps keep the scale sharp and meaningful.
An interesting challenge with this method is that people may not even realize their own attitudes. Some answer in ways they think they should, not how they really feel. This makes it hard to get honest data, but the method tries to reduce that risk.
Now, let’s look at Likert’s scale. It works differently. Instead of using experts to sort items, Likert uses simple rating choices. Statements are presented, and respondents pick options like “Strongly agree,” “Agree,” “Neutral,” “Disagree,” and “Strongly disagree.” Each option has a score, and researchers add these scores to measure the overall attitude.
Likert’s scale is more flexible and faster to use. It lets researchers study larger groups without the need for expert panels. But like the Thurstone method, it also depends on honest responses.
Understanding Observation as a Research Tool
Observation is another core tool in research. It’s one of the oldest methods used to understand human behavior. When researchers observe, they look closely at actions, gestures, speech, and facial expressions. These behaviors tell stories that people might not put into words.
John W. Best and others (1992) said that observation feels like human intelligence trying to decode life itself. This technique doesn’t rely on answers—it relies on what people do. That makes it powerful, especially in psychology and medicine. Doctors often learn more from a patient’s body language than from their spoken words.
Observation is also useful in classrooms, interviews, and group studies. Researchers watch participants and take notes about what they see. They record patterns, reactions, and context. These details offer real-time feedback that questionnaires and scales might miss.
However, observation has its limits. Sometimes, the researcher’s presence changes behavior. People act differently when they know someone’s watching. That’s why observers must remain neutral and non-intrusive.
The Interview: A Foundation for Deeper Insight
Interviews are more than just casual conversations. In research, interviews form the base upon which many insights rest. They offer depth. They go beyond checkboxes and ratings. Through interviews, researchers gather rich, detailed stories.
An interview allows one person to ask questions and guide the conversation. The interviewer can explore ideas, trace problems, and understand causes. They can listen to emotions, not just words. And they can even help the interviewee see their own challenges more clearly.
Unlike other tools, interviews adapt in the moment. They allow for follow-up questions. They give space for feelings. This flexibility makes them ideal for psychological and social studies.
More importantly, interviews support other tools. They add personal context to data gathered through scales and observations. They let researchers explore contradictions, clarify confusion, and build trust.
Wrapping It All Together
Each research tool has its own strength. Attitude scales reveal internal beliefs. Observations catch behavior in action. Interviews uncover layers that other methods miss. Together, these tools create a complete picture.
Researchers must choose carefully. They must consider the nature of the problem, the target group, and the context. When used together, these tools give depth, accuracy, and meaning to a study. They turn raw data into real understanding.